TL;DR
- Setup: two commercial LoRaWAN IAQ monitors in two rooms of an occupied Dubai residence, reporting every ~10 minutes. 5 May - 10 August 2026, 20,640 decoded readings (PM2.5, PM10, CO₂, TVOC, temperature, RH), stored in hash-chained rows.
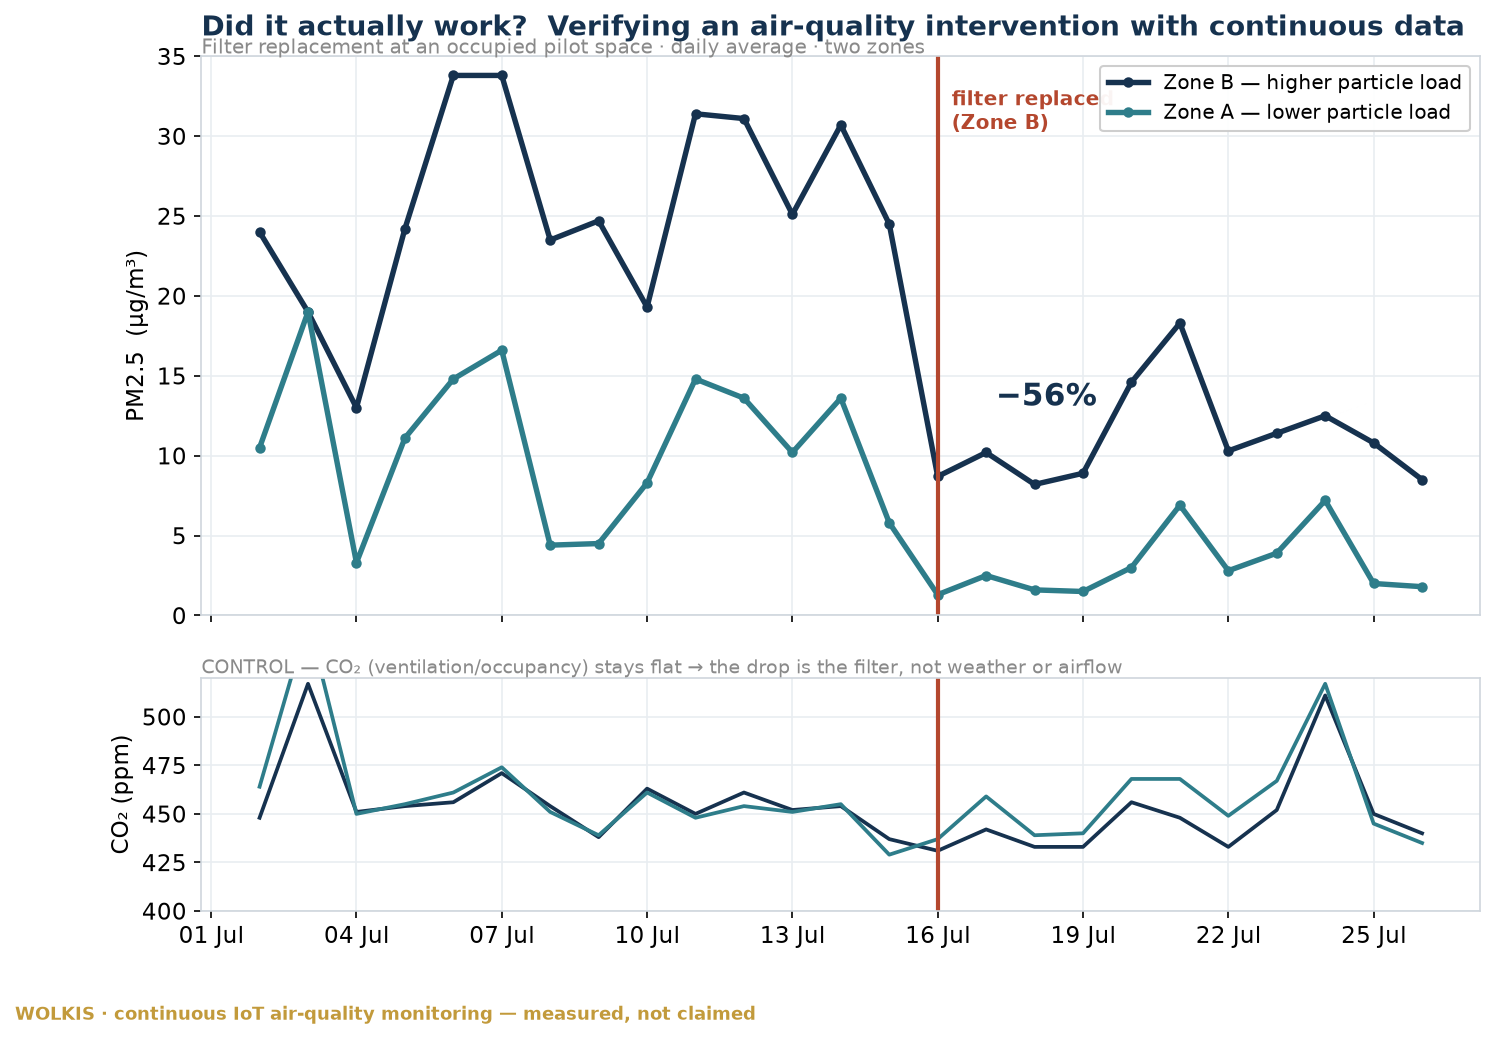
- Event: a routine HVAC filter replacement in the bedroom on ≈16 July, detected by a changepoint test on the data itself (t = 7.4).
- Result: bedroom daily-mean PM2.5 fell from 25.5 to 11.3 µg/m³ (−56%). CO₂ stayed flat through the change - occupancy and ventilation did not move, so the drop is attributable to the filter.
- Compliance: across the whole period, the WOLKIS record shows 0 of 3,481 rolling 8-hour CO₂ windows exceeded the DM-HSD-GU119 v4 limit of 800 ppm (maximum window: 577 ppm). PM2.5 exceeded its 24-hour limit of 35 µg/m³ on 7 of 158 sensor-days, clustered around May dust events and short indoor spikes.
- The real finding: with the same filter model in both rooms, the bedroom still runs ~3× dustier than the living room (9.9 vs 2.9 µg/m³). The remaining source is indoors. Only measurement tells you where the next dirham should go.
1. Method
Instrumentation. Two commercial LoRaWAN indoor air-quality monitors (NDIR CO₂, laser particle counter) in two rooms of an occupied residence in Dubai. Each device reports roughly every 10 minutes - about 140 readings per day. Readings are decoded server-side and appended to a database where every row carries a hash chained to the previous row, so the record is tamper-evident after the fact.
Intervention. A routine HVAC (fan-coil) filter replacement. The bedroom filter was replaced around 16 July; the living-room filter had been replaced roughly a week earlier. Nobody logged the exact hour - which is precisely the realistic condition: the changepoint was recovered from the data, not from a diary.
Attribution controls. Three, stated in advance of the numbers:
- CO₂ as control channel. If the PM2.5 drop had come from opened windows, changed occupancy or a ventilation change, CO₂ would move. It did not: daily means held between roughly 430 and 470 ppm through the change window.
- Between-room difference. The changepoint test runs on the difference between rooms, which subtracts outdoor dust episodes that hit both sensors alike. The step lands on 16 July with t = 7.4.
- Second room as comparison. The living room, already on a fresh filter, shows no comparable step on 16 July - it simply continues at its low level.
2. Results
| Quantity | Window | Value |
|---|---|---|
| Bedroom PM2.5, daily mean - before | 1-15 July (14 days) | 25.5 µg/m³ |
| Bedroom PM2.5, daily mean - after | 17-31 July (15 days) | 11.3 µg/m³ (−56%) |
| Bedroom PM2.5, daily mean - sustained | 17 July - 10 August | 9.9 µg/m³ |
| Living room PM2.5, daily mean - same period | 17 July - 10 August | 2.9 µg/m³ |
| CO₂ rolling 8-h windows above 800 ppm (GU119 v4) | full period, both rooms | 0 of 3,481 (max 577 ppm) |
| CO₂ hourly mean / maximum | full period, both rooms | 443-459 ppm / 650 ppm |
| PM2.5 24-h days above 35 µg/m³ (GU119 v4) | full period, 158 sensor-days | 7 days - see note |
Four bedroom exceedance days cluster around May regional dust events (36-44 µg/m³) plus one pre-filter July day at the limit. Three living-room days are short, extreme spikes (daily means up to 916 µg/m³) consistent with an activity right at the sensor - housekeeping or works - rather than ambient air. A compliance record that never shows an exceedance is a record you should distrust.
3. What this does and does not show
It shows the measurement layer working: detect a change → attribute it against controls → quantify it → keep a tamper-evident record. That chain - not the filter - is the product being demonstrated.
It does not show that filters halve PM2.5 in general (one building, one intervention), and it does not replace laboratory calibration: these are commercial-grade sensors compared against themselves over time, which is exactly the comparison step-change analysis needs, and exactly not a reference measurement.
And the finding that pays for the monitoring: the same filter model is installed in both rooms, yet the bedroom still runs about three times dustier at a slightly lower temperature (comparable fan-coil duty). The remaining particle source is indoors - textiles are the leading candidate - so the next improvement is source control in that room, not more filtration. Without continuous data, that conclusion is unreachable; with it, it is a fifteen-minute read of two charts.
4. Why we publish field data
Compliance platforms usually publish claims; audits and regulators increasingly want evidence. This page is the first in a series where we publish our own first-party telemetry with the method and the limitations attached - the same evidence format our reports produce for clients under Dubai Municipality guidelines (GU119 v4, GU141/EIAQI). Locations are anonymised to the city level; numbers are real; the record behind them is hash-chained.